Hi!
I am a creative and strategic thinker with a passion for problem-solving through human-centered design, UX research, and emerging tech exploration for an empathetic society.
I like to think of my mind like a ping pong game where creativity and intuition represent one half of the table and logic and reasoning represent the other half. The epic back and forth rally of thoughts and ideas, however always ends in a deuce.
Through my Master's journey at Carnegie Mellon University and early career footsteps, I found my ping pong mind to be most conducive to the world of user experience research.
Over the past 3 years, I have had the opportunity to build innovative digital experiences at The Economist Digital Media Lab, spearheading the research and development of a VR-based experience to promote empathy and mitigate hostile social interactions at Google.

HOW DO I WORK?
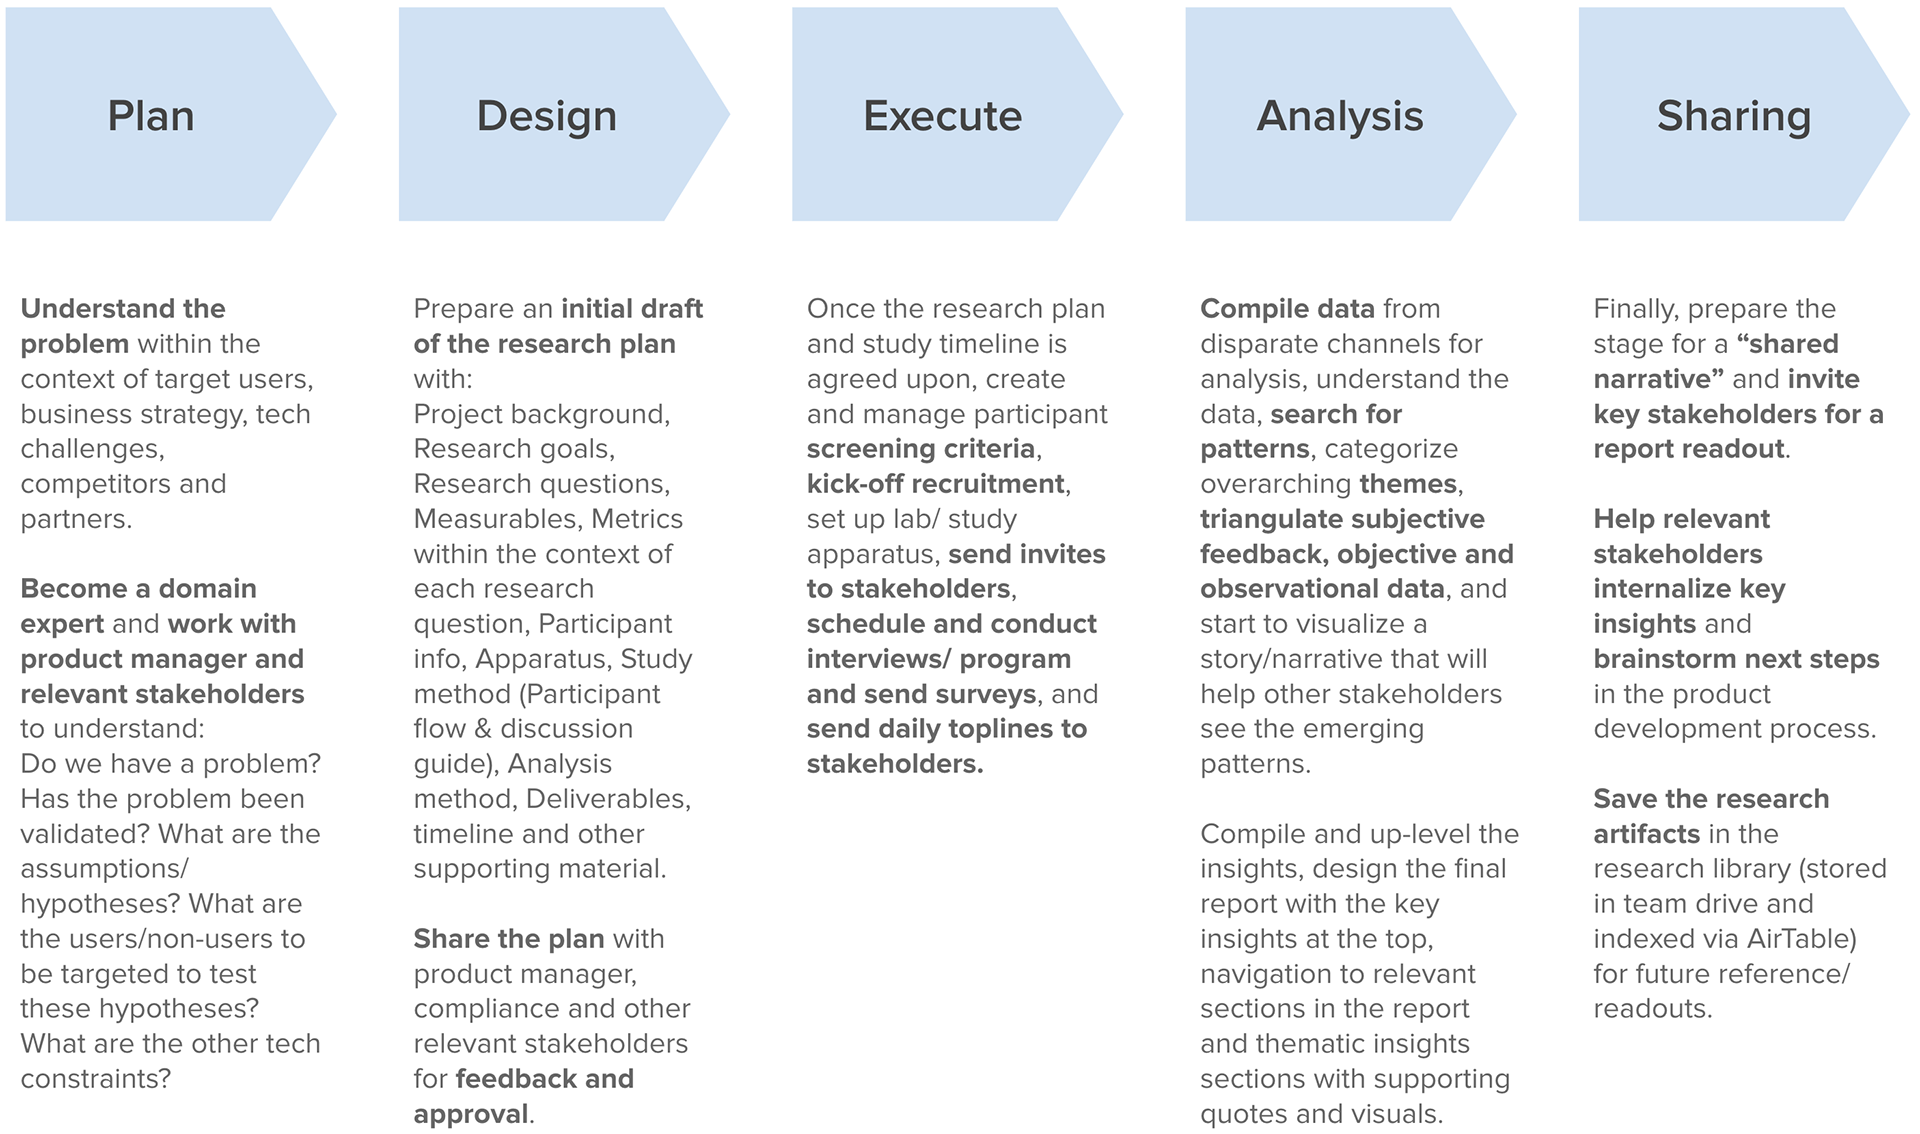
I conduct research for all stages of the product development cycle: from generative research in the discovery phase to validation oriented research in the execution and delivery phases. Here's how my typical end-to-end process looks like:
My avid interest in photography and filmmaking helps me weave in pixel level attention to details and elements of storytelling while writing final insights reports. While every team has different requirements, I have found success in using following general structure in my reports:

TEAM NAME: PROJECT NAME
Prepared by:
Stakeholders:
Date:
PROJECT BACKGROUND
A brief description explaining the precedent for the study and the rationale for conducting this study.
TL;DR
- Short blurb on study highlights, starting on a positive note to anchor readers
- Top 3 things that went well
- Top 3 things that could be better
- Link to highlight reels/ Gifs or images depicting interesting interactions
KEY INSIGHTS
5-7 up-leveled insights with quantified data where necessary. 1-2 sentences per insight with text hyperlinked to respective sections in the report body:
TABLE OF CONTENT
DETAILED INSIGHTS SECTION
Theme based nuanced description of the insights and reasoning behind such user data, quotes, and visuals:
Theme Title
Description of the key insight with consistent numbering
Supporting data and graphs, charts, etc.
Supporting quotes
Links to highlight reels/ Gifs or images depicting interesting interactions
APPENDIX
Links to past studies, other relevant docs, raw data, media files, etc.

WHAT METHODS DO I USE?
I utilize a broad toolkit of UX research methods– from exploratory methods (diary study, in-context interview, SME interviews) to generative and evaluative methods (surveys, benchmarking, IA validation, feature prioritization, usability testing, card sorting, A/B tests, statistical tests). I select the appropriate method based on stakeholder input, the research questions we are trying to answer, and the point in time where the product/ feature is at in the product development cycle.
MY RESEARCH TOOL KIT
I am also well versed in leveraging digital tools for remote UX research. Some of my favorites include:
1. DScout – for diary studies
2. UserTesting.com & UserZoom Go – remote usability testing and international recruitment (Moderated and unmoderated)
3. Qualtrics & Google Forms – surveys and recruitment
4. Optimal Workshop – open/closed card sorting and feature prioritization studies
5. Mural, Miro & Freehand – remote collaboration, note-taking, design thinking workshops and brainstorming
6. Airtable – UXR Ops planning, building research intake forms and insights repositories
